The Structural Logic of Production Frontiers
The production possibilities frontier (PPF) serves as the foundational geometric representation of scarcity, choice, and opportunity cost in economic theory. It illustrates the maximum possible...
The production possibilities frontier (PPF) serves as the foundational geometric representation of scarcity, choice, and opportunity cost in economic theory. It illustrates the maximum possible output combinations of two goods or services an economy can achieve when all resources are fully and efficiently employed. By distilling the complexities of a multi-sector economy into a two-dimensional model, the PPF reveals the fundamental trade-offs that define human organization. Whether an individual is deciding how to allocate hours between study and leisure, or a nation is balancing its budget between defense and healthcare, the structural logic of the production frontier remains the same. Understanding this model is essential for grasping how societies optimize their limited means to satisfy unlimited wants, providing a rigorous framework for analyzing economic health and growth.
Foundations of the Economic Boundary
Defining Scarcity and Resource Allocation
At the heart of the production possibilities frontier lies the inescapable reality of scarcity. Every economy possesses a finite quantity of resources, traditionally classified as land, labor, capital, and entrepreneurship, which limits the total volume of goods and services that can be produced at any given time. Because these resources are limited, choosing to produce more of one item necessitates a reduction in the production of another. This fundamental trade-off is the essence of resource allocation, where the primary challenge is to determine the most beneficial distribution of inputs across competing ends. The PPF visualizes this struggle by defining a clear boundary between what is currently achievable and what remains impossible given the existing resource endowment.
The process of allocation is rarely a simple calculation, as it involves weighing the subjective value of various outputs against their objective costs. In a command economy, this allocation is determined by central planners, whereas in a market economy, it is driven by price signals and consumer demand. Regardless of the mechanism, the structural logic of the PPF dictates that any movement toward more of one good must result in a sacrifice elsewhere. This sacrifice is not merely a financial figure but a physical reality of diverted labor hours, redirected raw materials, and repurposed machinery. By focusing on these physical constraints, the PPF forces us to look beyond monetary values and confront the underlying logistics of production.
The Core Assumptions of the PPF Model
To make the PPF economics model functional and instructive, economists rely on several simplifying assumptions that isolate the variables of interest. First, the model assumes that the economy produces only two goods, which allows for a clear visualization on a standard Cartesian plane. Second, it is assumed that the quantity and quality of all factors of production—the inputs of labor, land, and capital—are fixed during the period of analysis. Third, the level of technology is held constant, meaning no new inventions or processes can improve efficiency during the snapshot represented by the curve. Finally, the model assumes that all resources are being used with maximum efficiency, implying that no worker is idle and no machine is underutilized.
While these assumptions may seem restrictive, they are necessary for building an intuitive understanding of economic trade-offs. By "freezing" technology and resource levels, we can clearly see how the choice of one output directly impacts the availability of another. In the real world, technology and resources are constantly in flux, but the PPF provides the "ceteris paribus" (all other things being equal) environment required for rigorous analysis. This simplification allows students and policymakers to observe the pure mechanics of the production possibilities curve before introducing the complexities of global trade, inflation, or technological disruption. It serves as a laboratory for the mind, where the consequences of choice can be mapped with mathematical precision.
Visualizing Constraints: The PPF Graph Explained
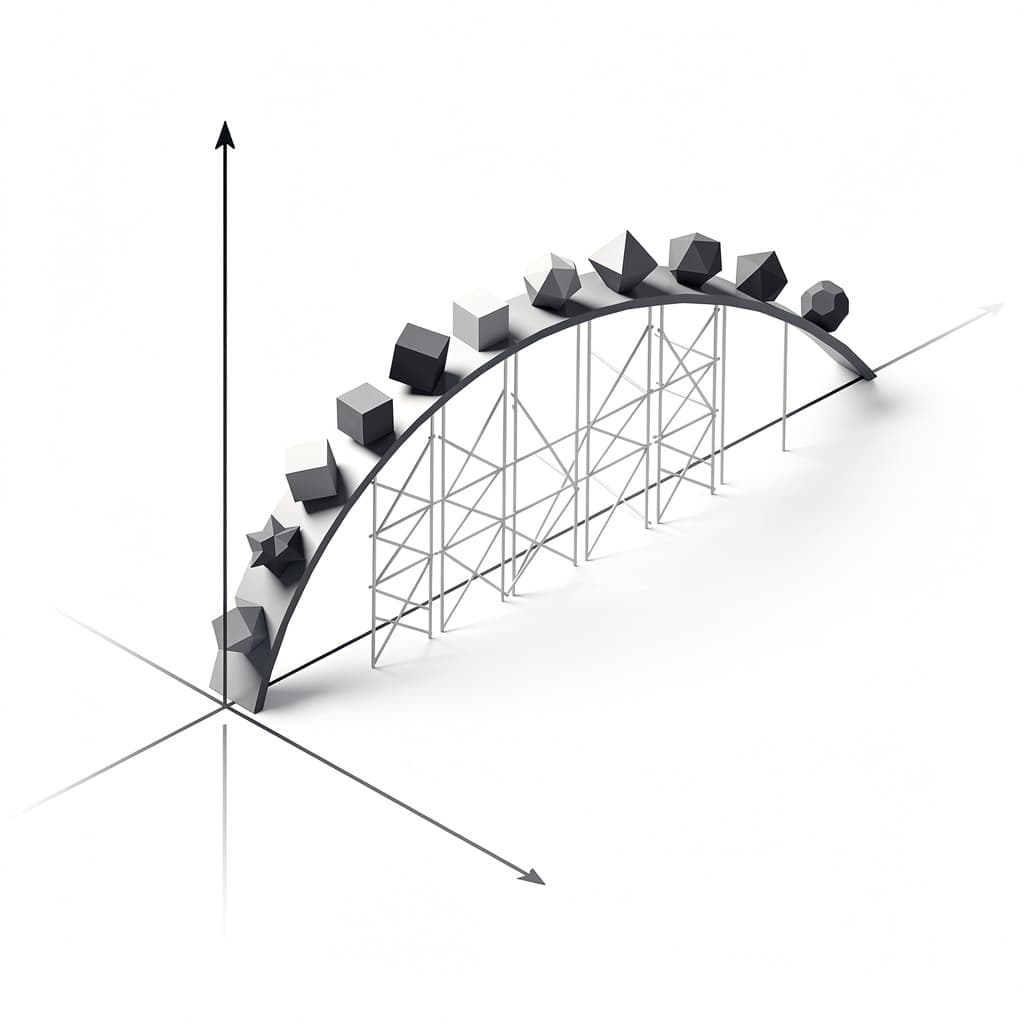
In a PPF graph explained for students, the vertical and horizontal axes represent the quantities of two different goods, such as "Computers" and "Wheat." The curve itself, often referred to as the frontier, represents the outer limit of an economy's productive capacity. Any point located on the curve indicates that the economy is performing at peak efficiency, utilizing every available resource to its fullest extent. Points lying inside the curve signify inefficiency or underutilization, where the economy is failing to reach its potential. Conversely, points located outside the curve are currently unattainable, representing a standard of living that the economy cannot yet support with its current technology and resources.
The shape of the curve is just as important as the points themselves, as it communicates the nature of the trade-offs being made. Most PPF curves are "bowed out" from the origin, a shape that reflects the reality that resources are not perfectly adaptable to all types of production. As we move along the curve, shifting resources from one good to another, we often find that the cost of producing an additional unit begins to rise. This visual representation allows for a quick assessment of an economy's status: a point deep inside the curve might suggest a recession or high unemployment, while a point on the curve suggests a thriving, fully employed workforce. The graph is thus a diagnostic tool, providing a snapshot of economic health and the limits of possibility.
The Geometry of Opportunity Cost
Slope and the Marginal Rate of Transformation
The opportunity cost and the PPF are inextricably linked through the slope of the curve, which is mathematically defined as the Marginal Rate of Transformation (MRT). The MRT measures the rate at which one good must be sacrificed to produce an additional unit of the other good. If we denote the two goods as $Y$ and $X$, the MRT at any given point is the absolute value of the slope of the frontier, expressed as: $$MRT = \left| \frac{\Delta Y}{\Delta X} \right|$$ This ratio represents the tangible cost of a decision; for every unit of $X$ gained, a specific amount of $Y$ is lost. As we move down the curve from top-left to bottom-right, the slope generally becomes steeper, indicating that we must give up more and more of good $Y$ for each incremental unit of good $X$.
This increasing slope is a direct reflection of the varying productivity of resources. Initially, when an economy produces very little of good $X$, it can use resources that are exceptionally well-suited for its production. However, as production of $X$ scales up, the economy is forced to employ resources that were perhaps better suited for good $Y$, leading to a higher marginal cost. This geometric relationship ensures that the cost of production is never a static number but a dynamic variable that changes depending on the current mix of output. The MRT provides the quantitative backbone to the qualitative concept of trade-offs, allowing economists to calculate the exact price of progress along the frontier.
The Law of Increasing Opportunity Cost
The law of increasing opportunity cost states that as you increase the production of one good, the opportunity cost to produce the next unit will eventually increase. This phenomenon occurs because resources are specialized and not perfectly interchangeable across different sectors of the economy. For instance, a highly skilled software engineer is extremely productive at creating digital tools but might be quite inefficient at farming wheat. If an economy decides to shift its entire focus from agriculture to technology, it will first move the engineers who were mistakenly farming, but eventually, it will have to move the experienced farmers into coding roles where they are less productive. This mismatch results in a disproportionate loss of wheat for every minor gain in software.
This principle explains why the production possibilities frontier is typically concave, or "bowed out," rather than a straight line. The curvature is a visual testament to the diversity of human talent and the specialization of physical capital. If resources were perfectly adaptable—meaning a tractor was just as good at processing data as it is at plowing fields—the opportunity cost would be constant, and the PPF would be a straight line. However, in a complex modern economy, specialized equipment and idiosyncratic human skills make the law of increasing opportunity cost a near-universal truth. Recognizing this law helps planners understand that "going all-in" on a single industry often results in diminishing returns and escalating costs.
Constant Versus Bowed-Out Frontiers
While the bowed-out frontier is the standard model for a national economy, a straight-line PPF represents a special case of constant opportunity cost. In this scenario, the resources used for both goods are essentially identical or perfectly substitutable. For example, if a small plot of land can grow either corn or soybeans with the exact same level of effort and yield ratio, the trade-off remains constant regardless of how much of each is planted. The mathematical expression of a straight-line PPF is a linear equation: $$Y = a - bX$$ where $b$ is the constant opportunity cost. This model is often used in introductory lessons to simplify the concept of the production possibilities curve before introducing the more realistic bowed-out version.
The distinction between these two shapes is crucial for understanding the limits of resource flexibility. A constant-cost PPF implies that the Marginal Rate of Transformation is the same at every point on the line, whereas a concave PPF implies an increasing MRT. Most production possibilities curve examples in textbooks start with the linear version to establish the idea of a budget constraint but quickly transition to the concave version to reflect the real-world friction of resource reallocation. By comparing these two shapes, students can visualize the difference between a simple, flexible production environment and a complex, specialized industrial landscape. This geometric nuance is the bridge between basic arithmetic and sophisticated economic modeling.
Defining Productive and Allocative Efficiency
Achieving Maximum Output on the Curve
Productive efficiency is achieved when an economy is operating on the production possibilities frontier, meaning it is impossible to produce more of one good without producing less of another. This state implies that all resources are being used in the most technically efficient manner possible, with no waste or mismanagement. In this condition, the economy is squeezing every ounce of value out of its labor force, land, and capital equipment. Productive efficiency is a measure of "doing things right," ensuring that the mechanical processes of the economy are tuned to their highest potential. It does not, however, account for whether the goods being produced are actually what society wants; it merely confirms that the production process itself is optimized.
When an economy fails to achieve productive efficiency, it resides at a point inside the frontier. This gap between actual and potential output represents a loss of welfare that can never be recovered. Common causes for this failure include unemployment, where human capital sits idle, or inefficient regulations that prevent resources from moving to their most productive uses. In some cases, a lack of competitive pressure in a market can lead to "X-inefficiency," where firms become complacent and allow production costs to rise above the minimum possible level. Achieving the frontier is a primary goal of macroeconomic policy, as it represents the realization of a nation's full physical potential.
Social Preferences and Allocative Choice
While productive efficiency focuses on the "how" of production, allocative efficiency focuses on the "what." An economy is allocatively efficient when it produces the specific combination of goods on the production possibilities frontier that provides the maximum benefit to society. There are infinite points along the curve that are productively efficient, but only one point—or a narrow range of points—aligns with the actual needs and desires of the population. For example, a nation could be productively efficient by spending its entire budget on military equipment, but if its citizens are starving and desire food instead, that point on the PPF is allocatively inefficient. Allocative efficiency requires that the marginal benefit of the last unit produced equals its marginal cost ($MB = MC$).
Determining the point of allocative efficiency is one of the most difficult tasks in economics because it involves aggregating individual preferences into a collective choice. In a market system, this is theoretically achieved where supply meets demand, and prices reflect both the cost to producers and the value to consumers. In the context of the PPF graph, allocative efficiency is the "sweet spot" on the curve that reflects the society's utility function. It represents a balance between competing values, such as growth versus consumption or public infrastructure versus private luxury. Without allocative efficiency, an economy may be technically perfect but socially stagnant, producing mountains of goods that nobody wants.
Identifying Underutilization and Inefficiency
Points located inside the production possibilities frontier are the visual signature of economic failure or underperformance. This area represents underutilization, where the economy is "leaving money on the table" by not using its available resources to their full extent. A classic example of this is a high unemployment rate during a recession; the labor is available, the factories are built, and the demand may even exist, but a breakdown in the economic machinery prevents these factors from coming together. In this state, the economy could produce more of both goods simultaneously simply by putting people back to work, which is why movement from the interior toward the curve is often called "recovery" rather than "growth."
Inefficiency inside the curve can also stem from institutional failures, such as corruption, poor education systems, or monopolistic practices that stifle innovation. These barriers act as a drag on the economy, preventing it from reaching the boundary of its potential. Structural inefficiencies are often harder to solve than cyclical ones; while a recession might be cured by monetary policy, structural issues require deep-seated reforms to the way resources are managed. By identifying these points of underutilization on the production possibilities curve, policymakers can better understand the nature of their economic challenges. Are they lacking the resources to grow (a frontier problem), or are they simply failing to use what they have (an efficiency problem)?
Dynamics of the Shifting Frontier
Technological Progress and Outward Expansion
The shifting the production possibilities frontier outward is the very definition of economic growth. One of the primary drivers of this shift is technological progress, which allows an economy to produce more output with the same amount of input. When a new invention, such as the steam engine or the internet, enters the production process, it effectively breaks the old constraints. The curve shifts to the right, making previously "unattainable" points suddenly feasible. This shift can be symmetrical, where technology improves the production of all goods, or asymmetrical, where an innovation specifically targets one industry. For instance, an improvement in agricultural technology would pivot the PPF outward along the "Wheat" axis while leaving the "Computers" axis relatively unchanged.
Technological growth does more than just increase quantity; it often fundamentally alters the quality and nature of the trade-offs involved. As production becomes more efficient, the opportunity cost of achieving a high standard of living decreases, allowing society to allocate more resources toward leisure, education, or environmental protection. This is the mechanism by which the luxuries of one generation become the necessities of the next. In the long run, technology is the only way to escape the "zero-sum" trap of a static PPF. Without innovation, an economy is limited to rearranging its existing pieces; with innovation, the entire board expands, creating new possibilities that were once the stuff of science fiction.
Resource Accumulation and Capital Investment
Beyond technology, the production possibilities frontier shifts outward due to the accumulation of the factors of production. This includes an increase in the labor force through population growth or immigration, the discovery of new natural resources, and, perhaps most importantly, investment in physical and human capital. Capital investment—building new factories, improving infrastructure, or educating the workforce—requires a society to sacrifice current consumption in favor of future production. On the PPF graph, this is visualized by choosing a point that favors "Capital Goods" over "Consumer Goods," which sets the stage for a larger frontier in the next period. This is the classic "sacrifice today for a better tomorrow" narrative of economic development.
The rate of expansion depends heavily on the percentage of current output dedicated to investment. Nations that consume most of what they produce will see their PPF remain relatively static, while those that invest heavily in education and machinery will see their frontier march outward at a rapid pace. This accumulation is a compounding process; as the frontier expands, the economy gains even more capacity to invest, leading to virtuous cycles of growth. However, this also highlights the "poverty trap," where nations with a frontier very close to the origin cannot afford to sacrifice consumption for investment, as they need every resource just to survive. Breaking this cycle often requires external intervention or radical institutional change to jumpstart the shift outward.
Contracting Frontiers and Economic Decay
While we usually focus on growth, it is also possible for the production possibilities curve to shift inward, representing a contraction of the economy. This economic decay occurs when a nation's productive capacity is permanently damaged or depleted. Catastrophic events such as war, natural disasters, or pandemics can destroy physical infrastructure and drastically reduce the labor force, forcing the frontier toward the origin. Environmental degradation is another long-term cause of inward shifts; if a country over-exploits its soil or water, it eventually loses the ability to produce at its former levels. These shifts represent a true loss of potential, meaning that even with 100% efficiency, the economy can no longer reach its previous peaks.
Institutional collapse can also cause an inward shift by destroying the systems that allow for efficient production. Hyperinflation, the breakdown of the rule of law, or extreme political instability can make it impossible for businesses to plan for the future, leading to a "brain drain" and the decay of capital. When the PPF shifts inward, the opportunity cost of basic survival rises, and the trade-offs become increasingly painful. Recovery from such a contraction often takes decades, as the nation must not only return to full efficiency but also rebuild the underlying resources and technology that were lost. Understanding these inward shifts is critical for assessing the long-term impact of crises on a nation's foundational strength.
Real-World Production Possibilities Curve Examples
The Capital Goods and Consumer Goods Trade-off
One of the most frequent production possibilities curve examples involves the trade-off between capital goods and consumer goods. Consumer goods are items like food, clothing, and entertainment that provide immediate satisfaction but do nothing to increase future production. Capital goods, such as specialized machinery, research facilities, and software, provide no immediate utility but allow for a much larger output in the future. A society that chooses a point on the PPF high in consumer goods is enjoying a high standard of living today but is effectively treading water. Conversely, a society that prioritizes capital goods is essentially "investing" in the outward shift of its future frontier, promising a much higher standard of living for the next generation.
This trade-off is often used to compare the economic trajectories of different nations. For instance, post-WWII Japan and West Germany famously tilted their production heavily toward capital goods and infrastructure, leading to the "economic miracles" of the late 20th century. Meanwhile, nations that prioritize immediate consumption or are forced to do so by debt often find their growth stagnating. The PPF makes this choice explicit: you cannot have both maximum consumption today and maximum growth tomorrow. It is a stark reminder that even the wealthiest nations must carefully balance their "seed corn" (capital) against their "harvest" (consumption) to ensure long-term viability.
Public Goods versus Private Consumption
Another profound application of the production possibilities frontier is the balance between public goods and private consumption. Public goods include things like national defense, public parks, clean air, and infrastructure—items that are typically provided by the government and are non-excludable and non-rivalrous. Private consumption refers to the goods and services individuals buy for themselves. Every dollar spent on a new public highway is a dollar that cannot be spent on private automobiles or luxury goods. This trade-off is at the heart of every national budget debate and reflects the fundamental tension between collective needs and individual desires.
On the PPF graph, this manifests as a choice between two different categories of social welfare. A movement toward more public goods might improve the overall environment or national security but could lead to higher taxes and lower personal disposable income. The "optimal" point on this curve is often a matter of fierce political debate, reflecting different ideologies about the role of the state. However, the PPF clarifies that this is not just a matter of "finding the money," but a matter of allocating the physical labor and materials of the nation. Whether the economy is capitalist or socialist, the physical frontier remains the ultimate arbiter of what can be built and what must be sacrificed.
The Guns and Butter Model of National Defense
The "Guns and Butter" model is perhaps the most famous production possibilities curve example in economic history. Originating as a way to describe the trade-off between military spending (guns) and civilian goods (butter), it became particularly prominent during the Cold War and the Vietnam War era. The model posits that a nation has a fixed amount of resources to divide between defense and social welfare. If a country decides to build a massive nuclear arsenal, it must necessarily divert steel, scientists, and funding away from hospitals, schools, and consumer products. The PPF visualizes this as a zero-sum game within the bounds of current capacity.
During the 1960s in the United States, President Lyndon B. Johnson famously attempted to pursue both "Great Society" social programs and the Vietnam War simultaneously. The "Guns and Butter" logic suggested that this would push the economy beyond its frontier, leading to overheating and inflation if the resources were not genuinely available. History showed that trying to ignore the frontier leads to economic distortions; without an outward shift in the curve (through growth), you cannot increase both sectors without consequence. This model remains relevant today as nations debate the cost of modernizing their militaries versus addressing climate change or healthcare crises, proving that the structural logic of the PPF is as much a political tool as it is an economic one.
International Trade and Comparative Advantage
Specialization and the Gains from Exchange
The production possibilities frontier is not just a limit; it is a baseline for understanding how international trade can improve global welfare. While an isolated nation is restricted to consuming what it can produce (its PPF), trade allows nations to specialize in the goods where they have a comparative advantage. According to David Ricardo’s theory, if Country A is relatively more efficient at producing computers and Country B is more efficient at producing wheat, both countries can benefit by focusing on their strengths and trading with each other. This specialization means the global economy as a whole moves toward a more efficient point on a "world PPF," maximizing the total output of both goods.
Specialization essentially allows a country to "trade away" the increasing opportunity costs it would face if it tried to produce everything itself. By focusing on the sector where its resources are most productive, a nation operates at a point of high efficiency. It then uses its surplus to acquire the goods that would have been very "expensive" for it to produce domestically in terms of sacrificed alternatives. This logic forms the basis for the modern globalized economy, where complex supply chains leverage the specific resource endowments of different regions. The PPF serves as the "before" picture in this narrative, showing the limited possibilities of autarky (self-sufficiency) versus the expanded possibilities of trade.
Consuming Beyond the Domestic Frontier
One of the most remarkable outcomes of international trade is that it allows a nation to consume at a point located outside its own production possibilities frontier. While the domestic production remains limited by the physical frontier, the consumption possibilities are expanded through exchange. If a country can trade one unit of wheat for two units of computers on the international market, but it would have cost three units of wheat to make those computers at home, the country is effectively "cheating" its domestic scarcity. This gain from trade is visualized as a consumption point that lies in the previously "unattainable" region of the graph.
This distinction between the production frontier and the consumption frontier is vital for understanding why trade is generally viewed as beneficial by economists. It does not mean the nation’s resources have increased, but rather that the value it can extract from those resources has been magnified through the efficiency of global markets. For the average citizen, this means access to a wider variety of goods at lower prices than could ever be produced by a single isolated country. The PPF thus becomes a dynamic tool; it shows the physical limits of a nation's hands, while trade shows the expanded reach of a nation's wallet.
The Transformation of Global Production Bounds
When multiple nations engage in trade, they effectively merge their individual production possibilities curve examples into a global frontier that is further from the origin than the sum of its parts. This is because trade encourages the movement of technology and "best practices" across borders, leading to an outward shift in the frontiers of developing nations. As countries integrate, they often experience "catch-up growth," where they adopt the more advanced technology of their trading partners. This transformation shifts the global boundary of what is possible for the human race, allowing for levels of production and consumption that would have been unimaginable in an era of isolated mercantilism.
However, this transformation also introduces new vulnerabilities. A nation that is highly specialized and consumes far beyond its frontier is dependent on the stability of global trade routes and the health of its partners' economies. If trade is disrupted by war or protectionism, the nation is forced back toward its domestic PPF, which can result in a sudden and dramatic drop in the standard of living. The structural logic of the production frontier thus explains both the immense rewards and the significant risks of globalization. It frames the world not as a collection of independent actors, but as an interconnected system where the limits of one nation are compensated for by the strengths of another.
Theoretical Limitations of the Model
Static Constraints in a Dynamic Economy
Despite its power, the production possibilities frontier is a static model that captures a snapshot in time, which can sometimes be misleading in a fast-paced, dynamic economy. In reality, technology and resource levels are not fixed; they are constantly evolving through feedback loops. For example, the very act of producing a certain good can lead to "learning by doing," which improves technology and shifts the frontier outward almost immediately. The PPF often fails to account for these endogenous growth factors, presenting a rigid boundary where a more fluid one might exist. For entrepreneurs, the frontier is not a fence to stay within, but a challenge to be overcome through innovation.
Furthermore, the model assumes that the "two goods" chosen for the axes are sufficient to represent the entire economy. While this is a useful pedagogical tool, it oversimplifies the complex interdependencies between hundreds of different sectors. In a modern economy, the production of "computers" depends on the "mining" of rare earth minerals, the "education" of engineers, and the "maintenance" of energy grids. A simple PPF graph explained in a textbook cannot capture these "input-output" relationships, which are often the source of bottlenecks and inefficiencies. While the logic of trade-offs remains sound, the application of the model requires a degree of caution when moving from theory to complex policy decisions.
The Assumption of Homogeneous Resources
The standard PPF model often assumes that resources within a category (like labor) are homogeneous, meaning every worker is the same. While the "bowed-out" curve attempts to address this by introducing specialized resources, it still operates on a high level of abstraction. In the real world, the "human capital" of a nation is incredibly diverse, and the friction involved in moving a worker from a failing industry to a growing one is much higher than the model suggests. Retraining programs, geographical relocation, and psychological barriers make the transition along the curve a slow and painful process, rather than the smooth movement depicted on a graph.
This limitation means that an economy might appear to be "inside the curve" (inefficient) when it is actually just in a state of transition. Structural unemployment—where workers’ skills no longer match the available jobs—is a form of inefficiency that the PPF can identify but cannot easily solve. The model assumes that if you want more of good X, you just "move" the resources, but it ignores the time and cost required to transform those resources. Because of this, the PPF can sometimes lead to overly optimistic views of how quickly an economy can pivot in response to new challenges or opportunities.
Institutional Barriers to Optimal Efficiency
Finally, the production possibilities frontier assumes that if an economy is not at the frontier, it is due to a lack of effort or a technical failure. It often overlooks the role of institutions—laws, regulations, property rights, and social norms—in determining where the frontier actually lies. A nation may have the best technology and plenty of resources, but if its legal system is corrupt or its markets are dominated by cartels, it will never reach its potential. In these cases, the "frontier" is effectively artificially constrained by the very rules of the game. These institutional barriers are often invisible on a standard PPF graph, which focuses on physical rather than social constraints.
Moreover, the model does not account for externalities, such as pollution or resource depletion, which might make a certain point on the frontier unsustainable in the long run. If an economy reaches the frontier by destroying its environment, it is effectively shifting its future frontier inward. A truly comprehensive view of the production possibilities curve would need to account for the "social cost" of production, ensuring that today's efficiency doesn't come at the expense of tomorrow's existence. By recognizing these limitations, we can use the PPF as it was intended: as a powerful but focused lens through which to view the fundamental logic of choice in a world of finite means.
References
- Mankiw, N. G., "Principles of Economics", Cengage Learning, 2020.
- Samuelson, P. A., & Nordhaus, W. D., "Economics", McGraw-Hill Education, 2009.
- Ricardo, D., "On the Principles of Political Economy and Taxation", John Murray, 1817.
- Krugman, P., & Wells, R., "Economics", Worth Publishers, 2015.
Recommended Readings
- The Worldly Philosophers by Robert L. Heilbroner — An engaging history of economic thought that provides the human context behind the development of models like the PPF.
- Common Sense Economics by Gwartney, Stroup, & Lee — A clear, accessible guide to the fundamental principles of economics, emphasizing how trade-offs shape our daily lives.
- The Undercover Economist by Tim Harford — Uses real-world scenarios to explain complex economic concepts, making the logic of the production frontier feel immediate and practical.